
Business Intelligence Implementation (Data Strategy)
This project started with a familiar moment: teams were asking good questions, but the answers were scattered across spreadsheets, inboxes, and different versions of the truth. Even when dashboards existed, it was not always clear where to find them or how to interpret them consistently.
I treated this as a data enablement initiative to establish consistent, discoverable, and trusted reporting that could scale. My focus was to help teams move from “finding data” to “using data” by building reporting that was consistent, transparent, and designed for real decision-making.
What I focused on
- Listening closely to what teams needed and why it mattered
- Creating dashboards that replaced manual reporting
- Aligning definitions so metrics were shared, not personal
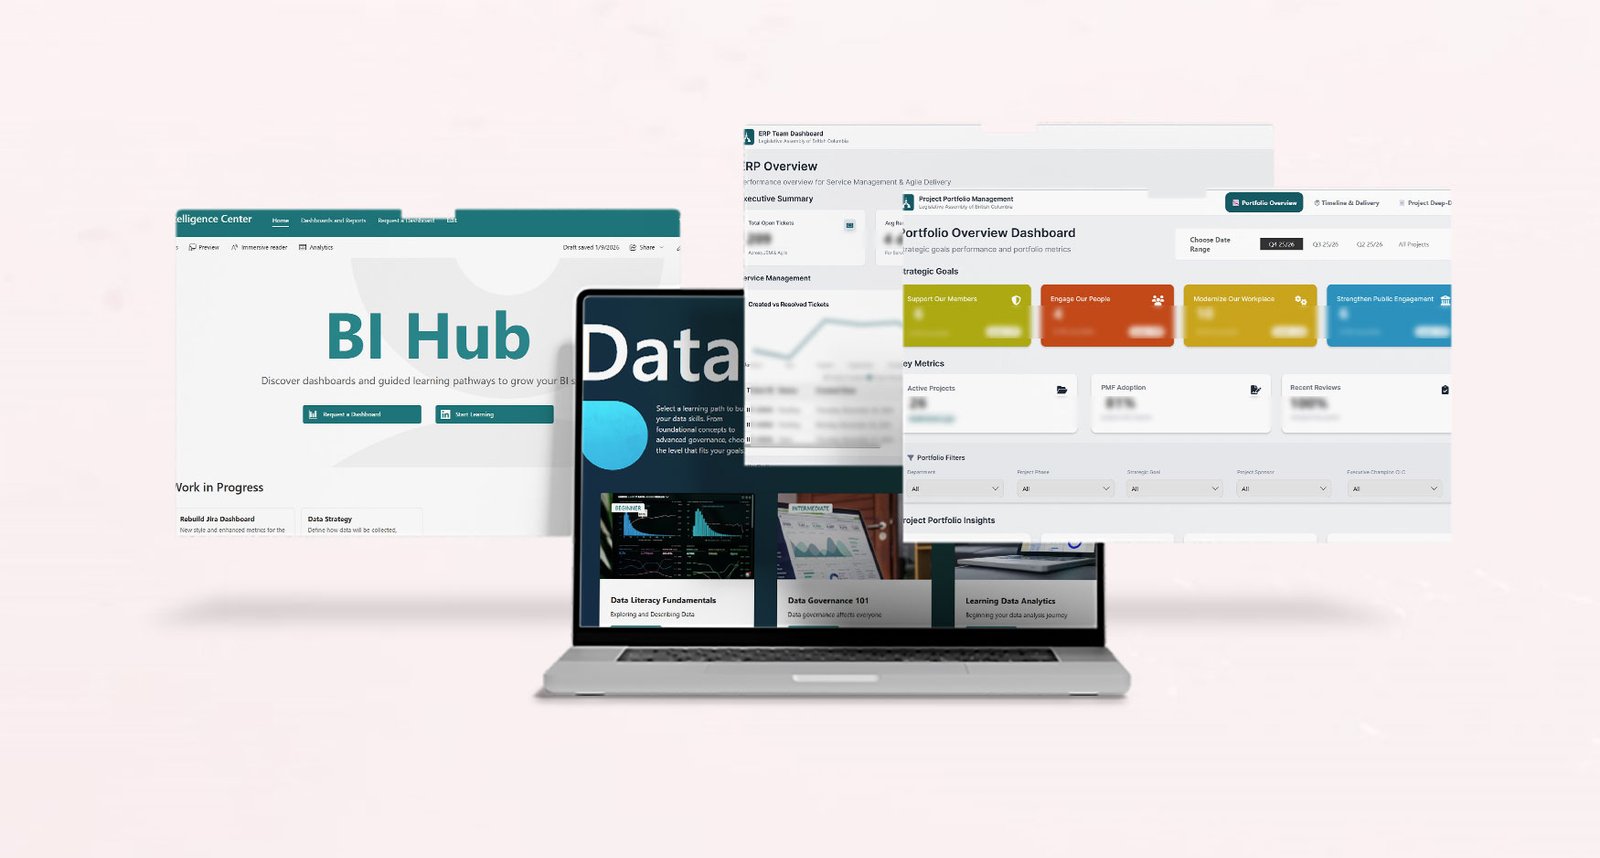
- Making everything easier to find through a BI Hub
- Building a learning cadence so the work stayed alive over time
Action
-
Created reporting across departments:
- I started by grounding each dashboard in real team needs, not assumptions.
- Facilitated conversations to understand what each department needed to see to do their work.
- Learned the project workflow and constraints before designing anything.
- Mapped available data sources (including informal tracking in spreadsheets, emails, and personal trackers).
- Designed and delivered initial dashboards to replace manual reporting and one-off requests.
-
Co-designed dashboards with teams:
- I treated each dashboard as a shared design effort, shaped by the project context and team needs.
- Partnered with teams to co-design the dashboard layout, KPIs, and filters.
- Translated team questions into a practical data model that supported consistent reporting.
- Iterated quickly using stakeholder feedback to refine both the structure and usability.
-
Aligned metrics across projects:
- Organized datasets so reporting could be repeatable and maintainable.
- Defined key metrics in plain language (including scope, assumptions, and intended use).
- Documented definitions and logic to reduce duplication and rework.
- Aligned shared metrics where consistency mattered, while keeping flexibility for project-specific needs.
-
Designed dashboards for decisions:
- I focused on dashboards that supported decision-making conversations, not just presenting numbers.
- Prioritized key signals over visual noise.
- Used clear layout and hierarchy so trends were easy to read.
- Designed filters and breakdowns so stakeholders could answer follow-up questions independently.
- Designed with the question “What decision does this support?” in mind.
-
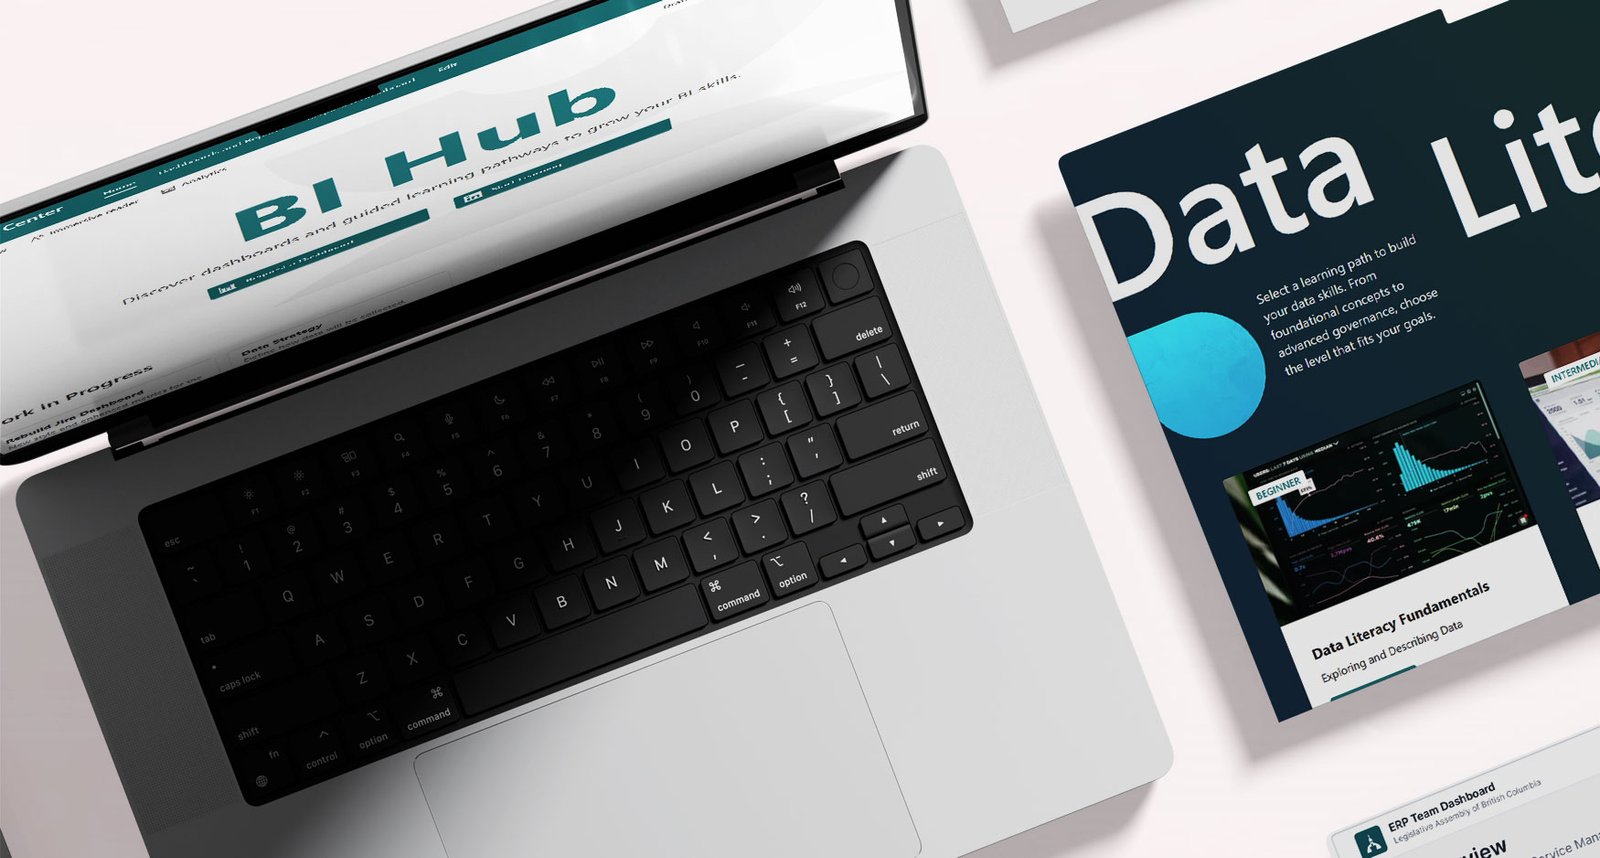
Built a shared Business Intelligence Center:
- Centralized dashboards so reporting became easier to find and reuse.
- Published supporting context, including metric definitions, data sources, refresh schedules, and ownership.
- Made reporting easier to validate and easier to trust across teams.
-
Planned adoption through education:
- Established a plan for monthly BI meetings to review insights and trends.
- Created space to validate definitions, align on evolving questions, and support data literacy.
- Reinforced shared ownership so reporting stayed consistent over time.
Result
Reporting shifted from scattered and manual to consistent and discoverable. Teams gained access to dashboards that reflected their specific project needs, while still using shared data and aligned definitions where consistency mattered. Conversations also changed over time: there was less effort spent finding numbers or reconciling versions, and more time spent interpreting trends, validating assumptions, and deciding what to do next. The BI Hub became a shared reference point across departments, helping teams trust the reporting and creating a foundation to scale analytics, governance, and ongoing enablement.
Case Information
- Clients : Internal (Public Sector)
- Date : Ongoing
- Category : Data Strategy, BI Enablement
What I Enjoyed Most
This project had the kind of scope I genuinely enjoy. I was involved end-to-end, from early discovery to delivery and adoption planning, which gave me the time and space to understand how each department works, what they need from reporting, and where things typically break down in practice.
I also really enjoyed the balance between strategy and execution. Some days that meant running alignment conversations and stakeholder discussions, other days it meant sketching and prototyping dashboard flows in Figma, and then switching gears to work hands-on with data structures and reporting logic. Throughout the process, I kept iterating with teams through a collaborative, co-design approach.
That mix of systems thinking, practical delivery, and partnership is where I feel most engaged, and it is usually where the most sustainable outcomes come from.
Skills Used in This Case
A combination of hands-on technical delivery and enablement work, focused on making reporting usable, discoverable, and trusted.
Technical
Tools and technologies used to implement the BI Hub and dashboards.

SharePoint (BI Hub)
Used as the central BI Hub for dashboards, documentation, ownership, refresh schedules, and discoverability.
Power BI (DAX & Power Query)
Built dashboards and measures, structured data models, and supported consistent metric definitions.
JSON (SharePoint Formatting)
Applied JSON formatting to improve list presentation, navigation, and usability within the BI Hub.
HTML
Structured and customized hub content and supporting pages for clarity and reuse.
Figma (Prototyping & IA)
Prototyped dashboard layouts, hub structure, and information architecture before implementation.
Non-technical
Skills that enabled adoption, alignment, and long-term use.
Stakeholder Alignment
Worked with teams to clarify reporting needs, priorities, and decision contexts.
Metric Definition & Consistency
Established shared definitions to reduce conflicting numbers and improve trust in reporting.
Data Enablement
Designed reporting and documentation to support self-serve use, not ongoing dependency.
Change Enablement
Introduced BI as a shared practice, not a one-off delivery, supporting gradual adoption.
BI Education & Cadence
Planned monthly BI touchpoints to review insights, align metrics, and build data literacy over time.